Activity Control Dashboard
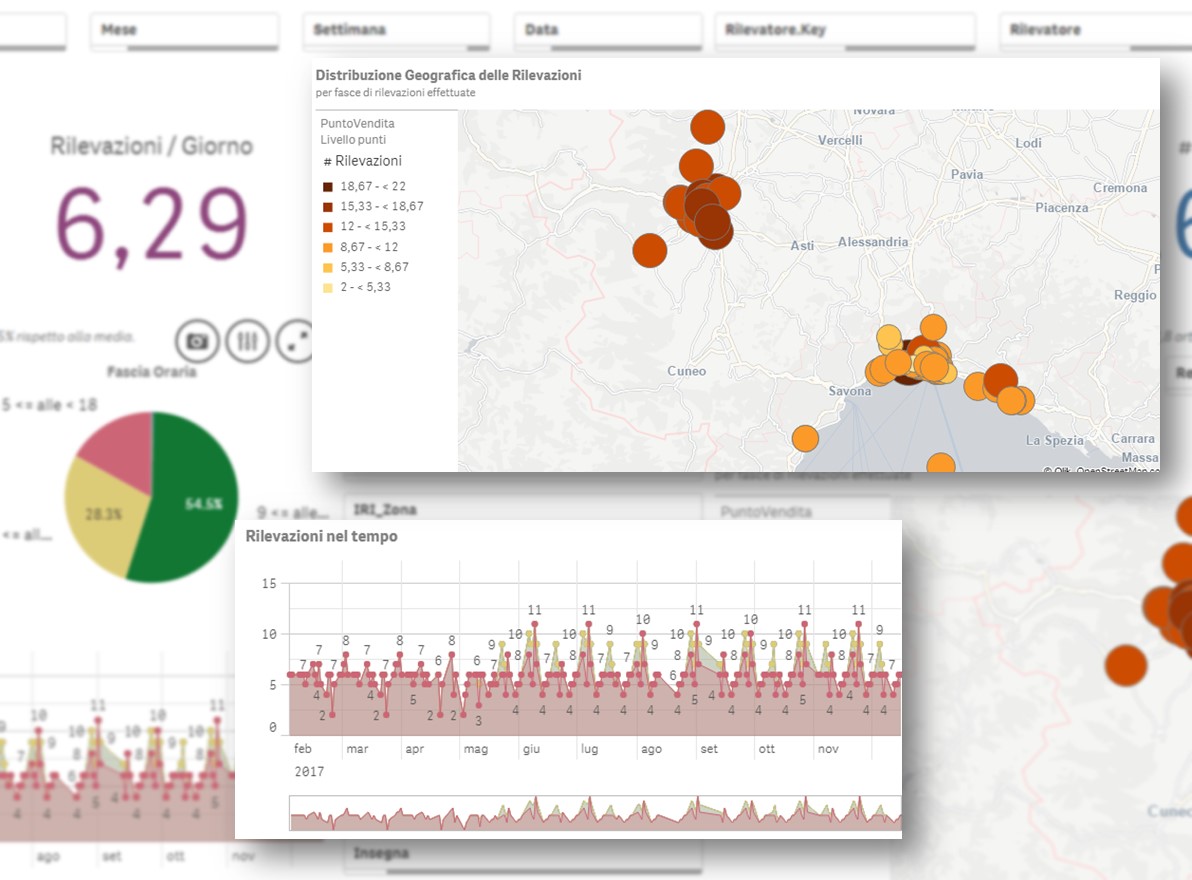
An activity summary dashboard to show the frequency and duration of surveys, efficiency of operations in relation to the number of references surveyed, distribution of shops surveyed – by type, sign, cluster and relative frequency of observation in a given time period.
The surveys can also be grouped by day of the week and time of day to allow a subsequent focused analysis on the most significant days and times of day.
Assortment analysis
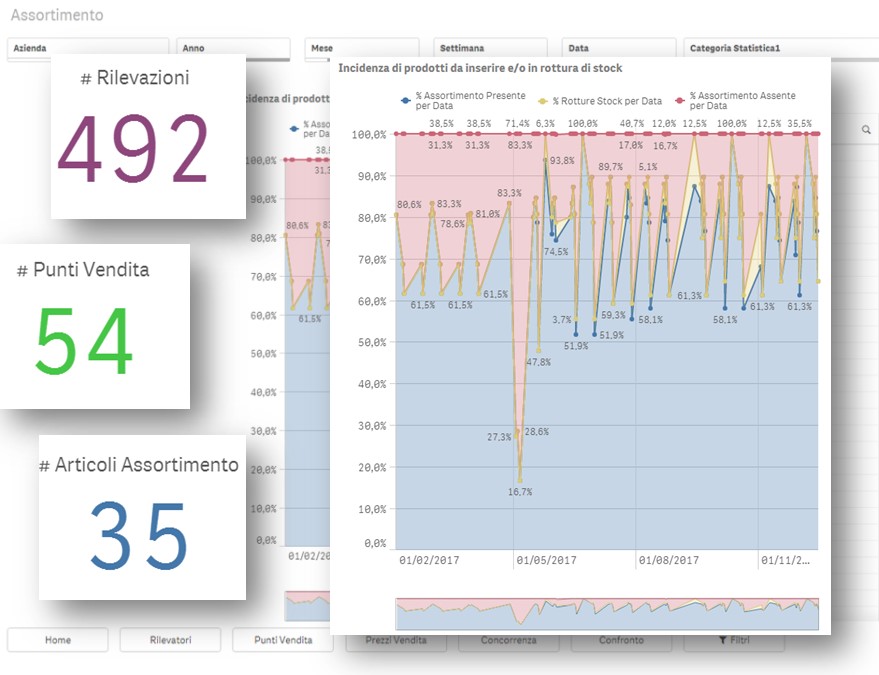
The observation over time of the coverage of the negotiated assortment with the detected assortment is a key indicator to ensure the correct and best sell-out of products.
The incidence of out-of-stock products determines the quality of the individual shop, or – if aggregated – of the specific retailer, in the different types of area in which its network of shops is organised.
Product presence can be further analysed by typical location and average facing, so as to highlight inhomogeneities in product positioning for the same cluster of stores.
Price, promotion and competition analysis
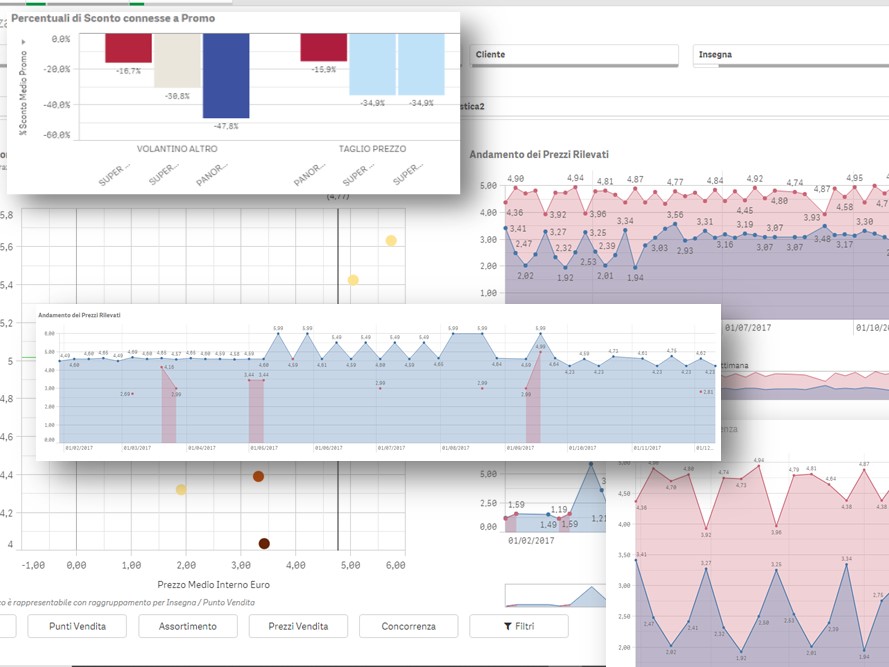
The price analysis allows an immediate visualisation of the trend over time, superimposed on the prices applied during the promotional periods, with an indication of the events applied, the brands involved, and the percentage measure of the discount applied to the end consumer. Suitably fed, the analysis system is also able to determine the non-application of agreed promotional actions for a given period.
By selecting homogeneous baskets of products and particular sets of stores and/or geographical areas, it is possible to compare the prices of one’s own references with those of competitors in a similar way.
By having sell-out data, it is also possible to analyse the effectiveness of promotional actions, measuring the benefits obtained from higher sales versus lower transfer prices granted.
Geographical analysis
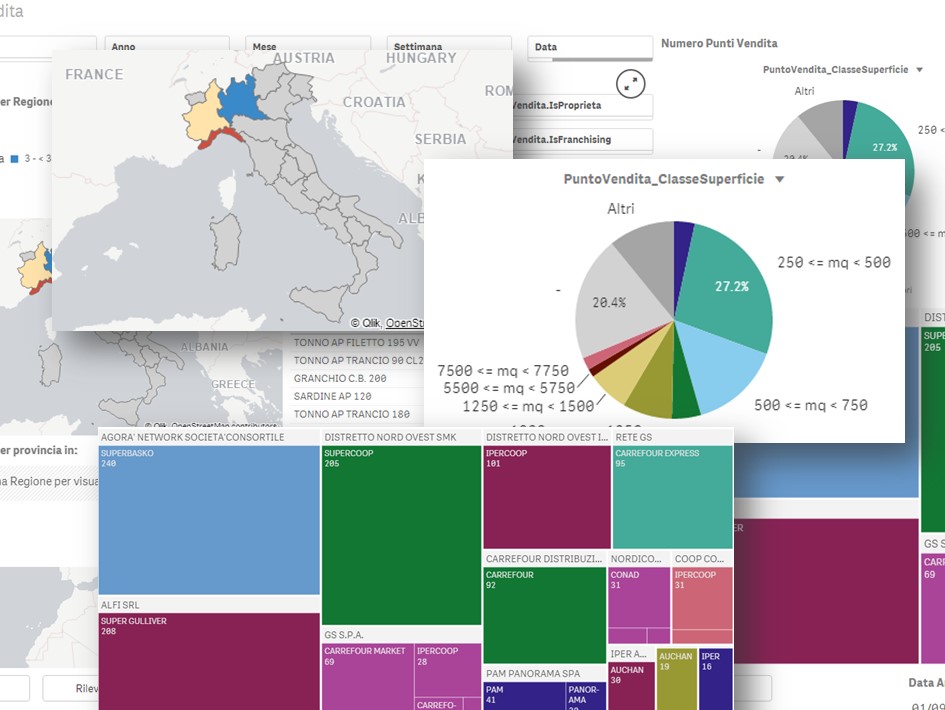
The integrated cartography and the mapping functions based on the GPS position of the points of sale enable ‘visual’ analyses of the distribution of its references, segmenting the territorial observations according to the retailer’s organisational structure and the type of point of sale, giving the user a perfect perception of the distribution of products and areas of lower penetration.
Reporting
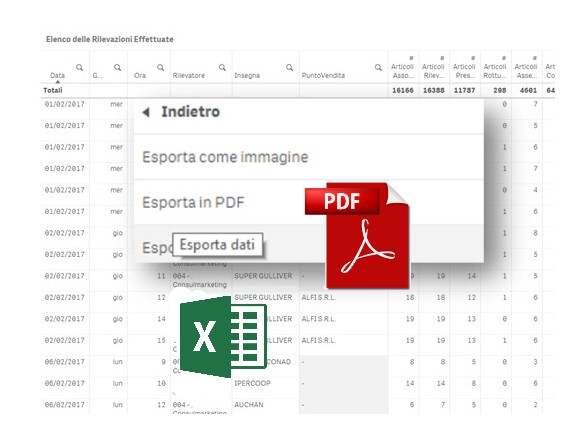
All analyses can be easily exported to individual productivity and office automation tools, e.g. Microsoft Excel, to be distributed or processed differently.
With the analysis tool, it is possible to build and export presentations in PowerPoint or Acrobat .pdf format; a sophisticated ‘bookmarking’ system allows particular selections to be stored in the data and applied at any later time, quickly obtaining ‘particular views’ that are always up-to-date with the latest imported data.

